LSE Course 1 Assignment
In 2025 I returned to education with the London School of Economics and Political Science Career Accelerator programme in Data Analytics. Course 1 "Data Analytics for Business" provided a combination of familiarity and challenge. I went in confident about my abilities with MS Excel, with a reasonable basic foundation in SQL and I had used Tableau as a Viewer but not as a Creator.
Course summary
- Applying structured thinking – using frameworks such as "Five Whys" to formulate business problems and inform the approach
- MS Excel – An old friend, which I have been using in business for more than 20 years. I learned some new functions that I had not used previously but I was within my comfort zone in this module
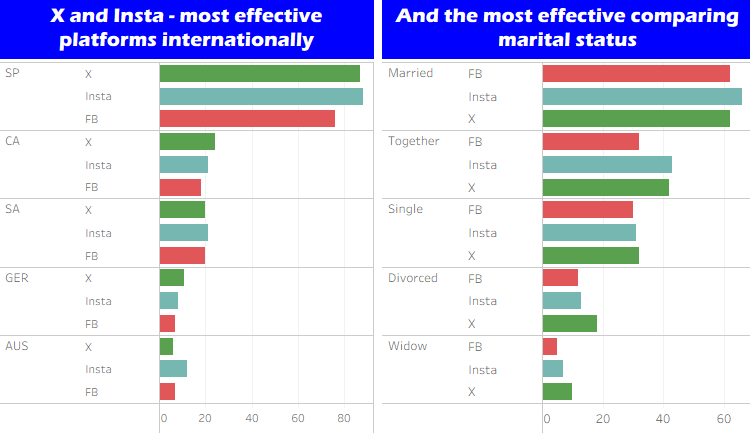
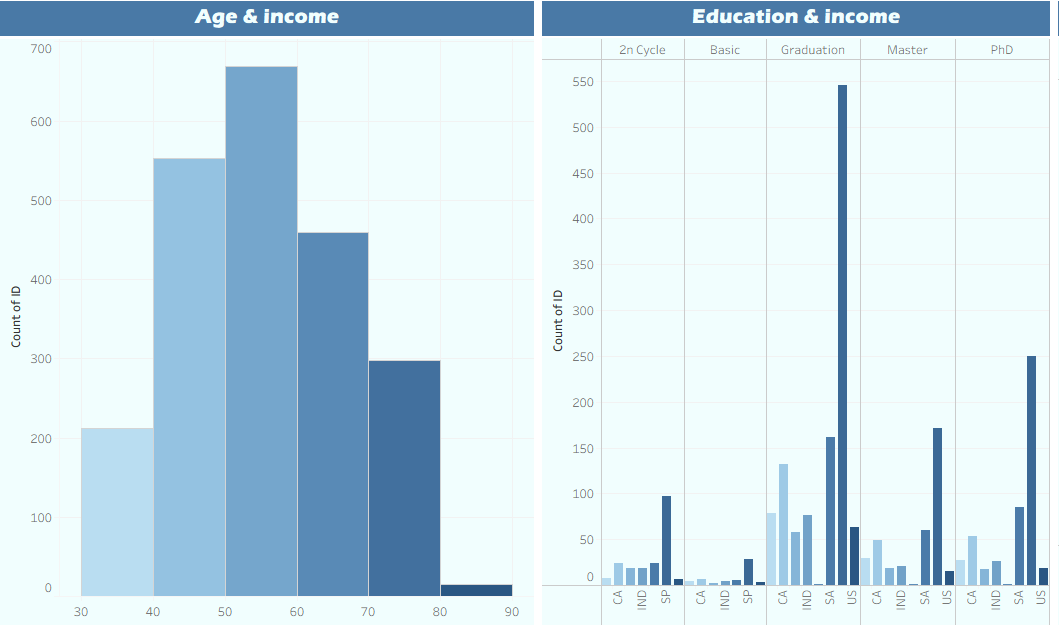
- Tableau – Learning a very powerful visual analytics platform for the first time. I explored, analysed and shared data through interactive dashboards and charts as my learning curve steepened
- PostgreSQL – I have supported applications in business with a SQL backend for many years and had a reasonable foundation. That said, this course helped me develop my understanding of database architecture, query writing and best practice.
Submission
My Tableau file, the accompanying technical report outlining my approach and post assessment feedback.
Iterations
I produced a revised version of my dashboard in Tableau based on the feedback from the course facilitator.
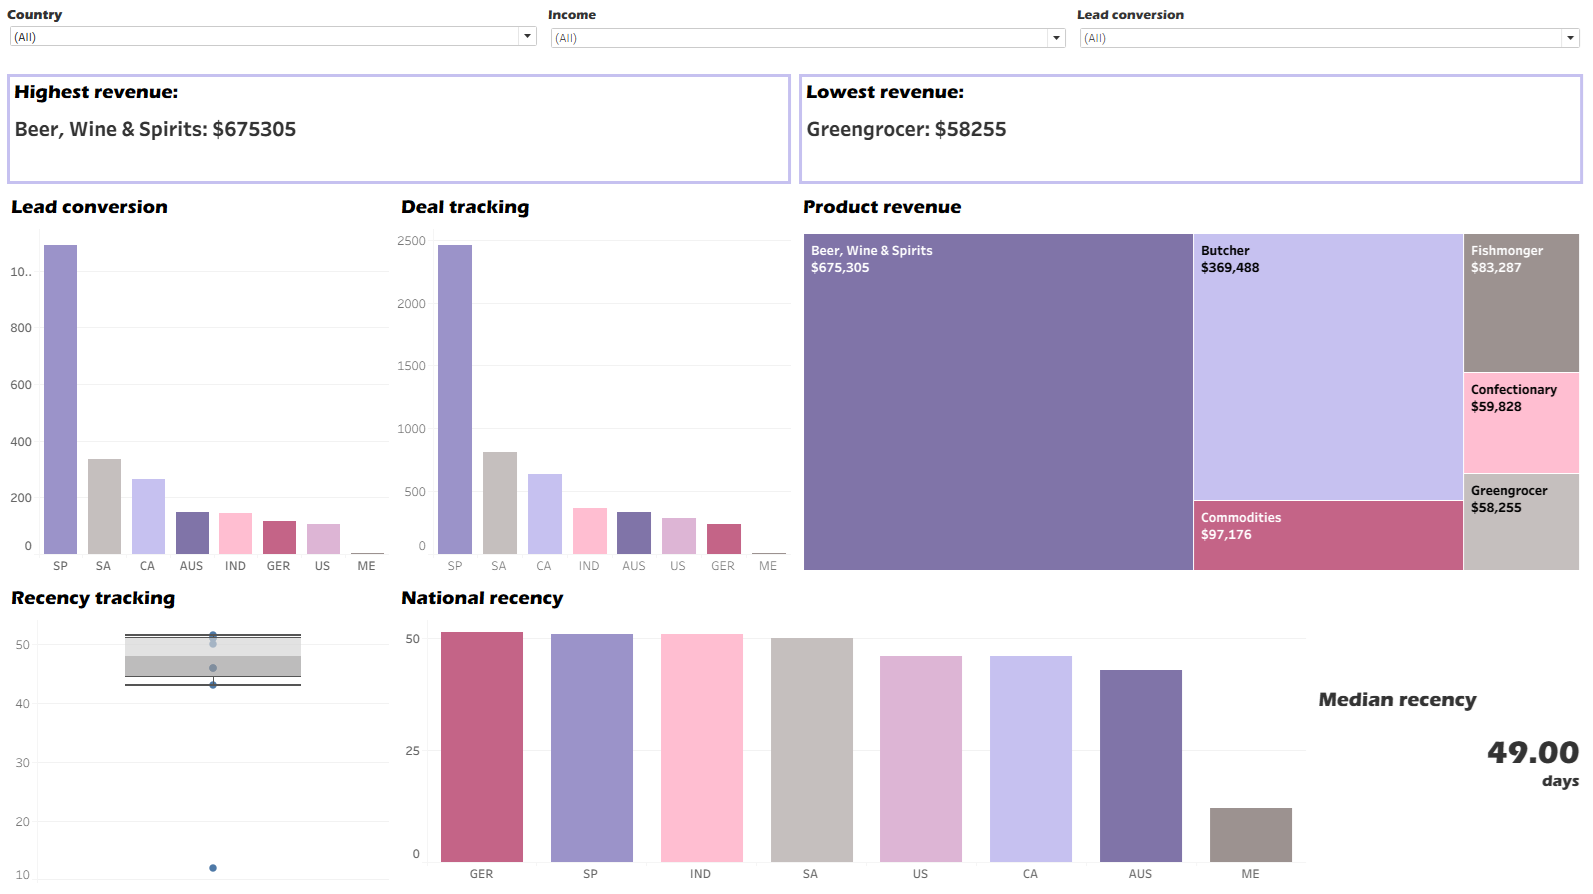
Continuing to develop my dasboard, I created a version which stakeholders could use to track my recommended objectives and their effect to revenue. I also learned to embrace white space from a design perspective.
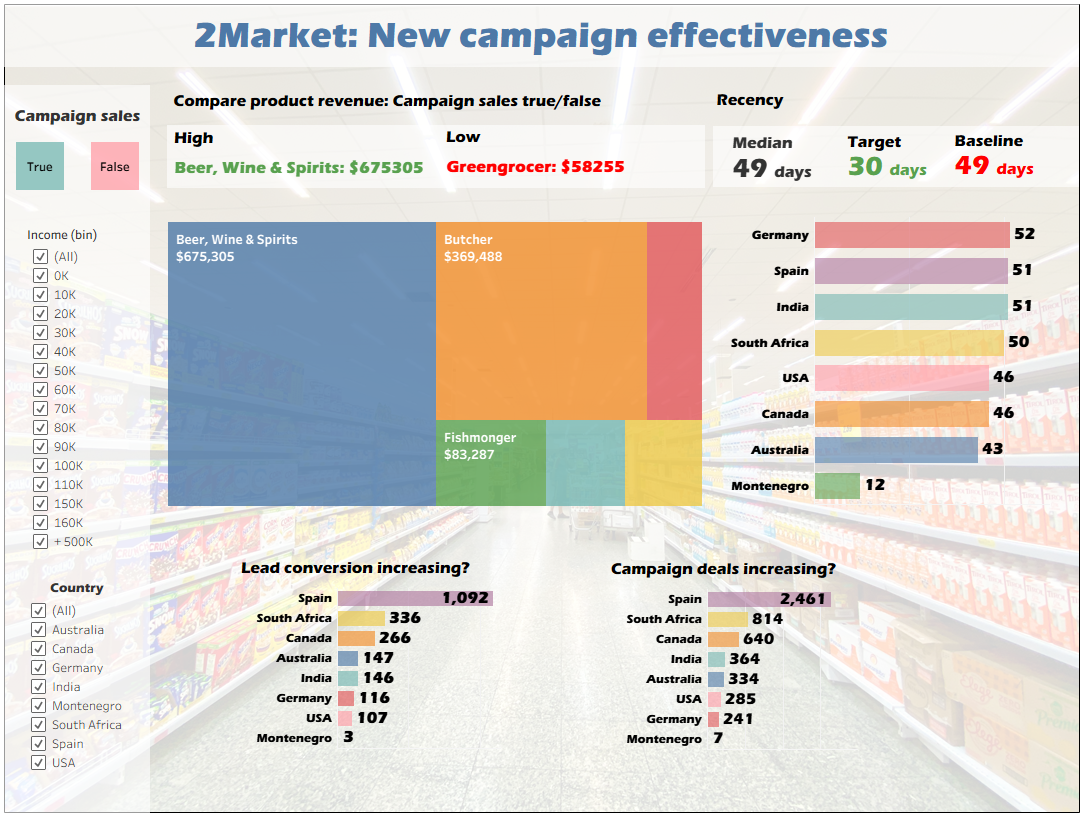
As an admirer of dashboard designs, I developed my 2Market dashboard in Tableau further to explore interactivity and impactful design. Then, I pushed further: Could I recreate the same experience in Looker Studio, a tool I'd never used? This mini-project documents the translation from Tableau's flexibility to Looker Studio's more static logic and highlights the different ways each tool handles data, visuals, and user interaction to achieve a similar goal.